What do RA, RZ, RP, RQ and RSM represent in the roughness parameters
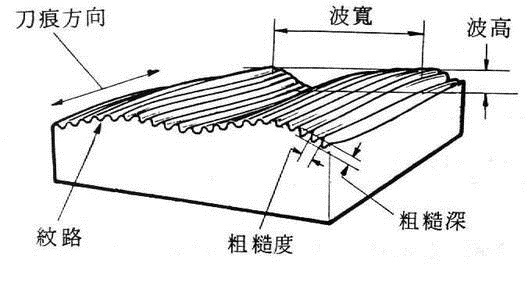
surface roughness refers to the roughness of processed surfaces with small spacing and small peaks and valleys [1]. The distance (wave distance) between two peaks or two valleys is very small (less than 1mm), which belongs to the microscopic geometric error. The smaller the surface roughness, the smoother the surface.
Surface roughness is generally formed by the machining method used and other factors, such as the friction between the tool and the part surface during machining, the plastic deformation of the surface layer metal during chip separation, and the high frequency vibration in the process system. Due to the difference in processing methods and workpiece materials, the depth, density, shape and texture of the marks left by the machined surface are different.
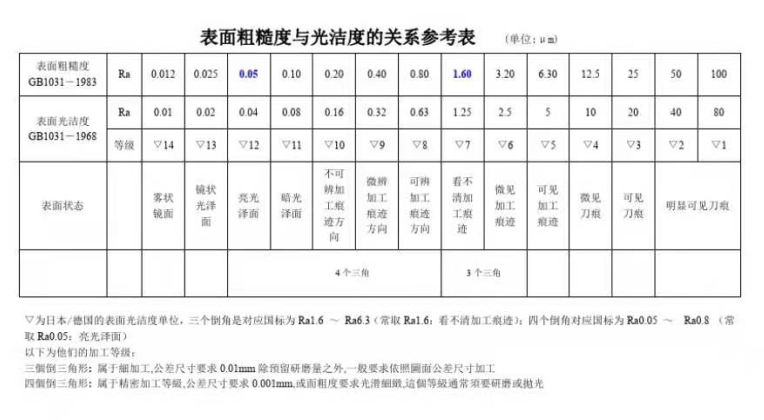
Surface roughness is closely related to the fitting property, wear resistance, fatigue strength, contact stiffness, vibration and noise of mechanical parts, and has an important influence on the service life and reliability of mechanical products. Generally, Ra is used for annotation.
1. RA: indicates the arithmetic mean deviation of contour.
The arithmetic mean of the absolute value of the distance between points on the contour line along the measurement direction (Y direction) and the reference line over the sampling length.
2, RZ: micro unevenness 10 o 'clock height.
Refers to the sum of the mean value of the 5 maximum contour peak heights and the mean value of the 5 maximum contour valley depths within the sampling length.
3. Rp: maximum contour crest height.
The distance between the highest peak line and the lowest bottom line of the largest contour within the sampling length.
4. Rq: root mean square roughness.
5. RSM: indicates the average width of the contour unit.
The average distance between the microscopic unevenness of the contour over the sampling length.


News
- 2023 The 22nd China International (West) Optoelectronic Industry Expo has come to a successful end!
- Under the epidemic, thank the city government care!!
- Xibin Optoelectronic - Optical laboratory was officially established!!
- Xibin Photoelectric is open for business!!
- The second China · Fuzhou Optoelectronic Industry Forum came to a successful end!!
- 2021 Shenzhen Light Fair CIOE ends smoothly!!
- Warmly welcome Sheyang County Party Secretary, county governor inspection Xibin photoelectric!!
- 2021 Shanghai Munich Optoelectronics Show a perfect end!!
- Sheyang County Party Secretary field guidance Xibin photoelectric new park construction!!
- Congratulations [Xibin photoelectric] to become a member of the Fuzhou photoelectric Industry Association!!
News
- Manufacturing process of optical glass lens
- What do RA, RZ, RP, RQ and RSM represent in the roughness parameters
- Global trend of industrial structure adjustment in optical cold processing industry
- What special symbol does optical glass have
- Polishing techniques for glass
- The grinding technique of glass
- Optical glass and optical cold working
- Science form and position tolerance
- The difference between granite and marble


